Teacher Value-Added
Understanding the Report
The teacher value-added model is used to measure the contribution of a teacher to student learning growth. The value-added model does this by measuring the difference in each student's actual performance on a statewide assessment from that student's expected performance, which takes into account specific student and classroom factors that impact the learning process.
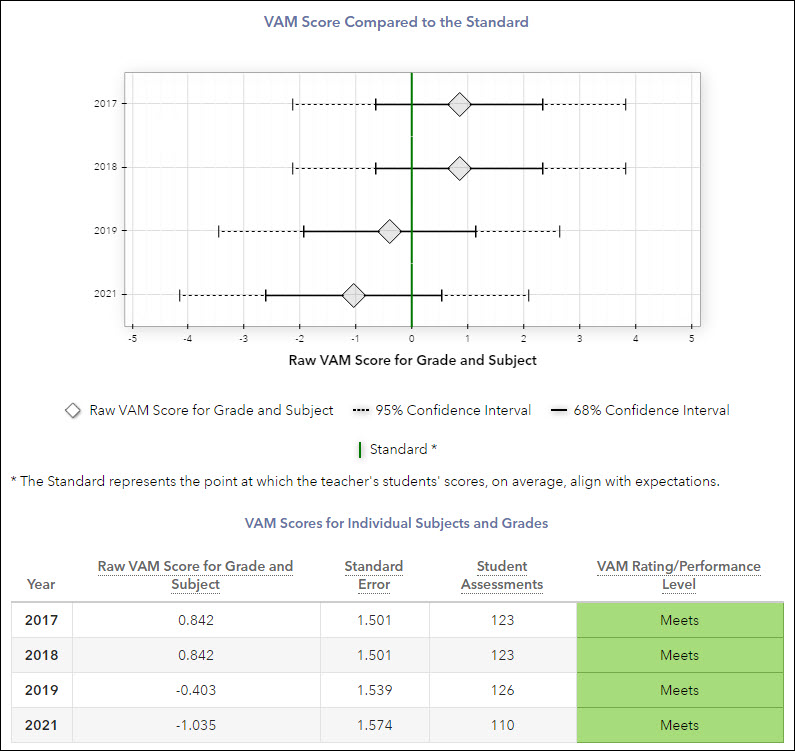
Raw VAM Score for Grade and Subject
The average number of points on the developmental scale of this assessment that students' scores differed from expectations as a result of this teacher's impact. The raw VAM score for grade and subject is a reliable measure of whether the teacher's students exceeded, met, or fell short of the standard.
95% and 68% Confidence Intervals
A teacher's VAM score is based on the students that they taught. To estimate how well a teacher might have performed with other, similar students in a way that is fair, statistically valid, and reliable, the model uses the standard error to create confidence intervals that express how much evidence there is that a teacher's VAM score would have been among a range of values if the teacher had taught other, similar students. It is computed by both adding and subtracting a multiple of the standard error to the VAM score. The multiplier used is determined by the level of precision desired as well as the number of students on a teacher's roster. Generally speaking, for a 95% confidence interval the multiplier is 1.96 times the standard error, but for teachers with smaller numbers of students, the multiplier is larger. For a 68% confidence interval, the multiplier is typically 1.0 times the standard error, but for teachers with smaller numbers of students, the multiplier is larger.
To calculate a 95% confidence interval for a teacher with a large number of students and a three-year aggregate combined VAM score of -0.20 and a standard error of 0.15, we start by multiplying the standard error (0.15) by 1.96 (again, this multiplier may be slightly larger for teachers with a smaller number of students. To find the exact multiplier, use a T-distribution table).
0.15*1.96= 0.294
Next, we add and subtract this value from the teacher's three-year aggregate combined VAM score to get the 95% confidence interval.
-0.20-0.294= -0.494
-0.20+0.294= 0.094
95% confidence interval= -0.494 through 0.094
This means that we can be 95% confident that the teacher's VAM score would be somewhere between -0.494 and 0.094 had the teacher taught a different combination of other similar students.
The 68% confidence interval would be:
0.15*1= 0.15
-0.20-0.15= -0.35
-0.20+0.15= -0.05
68% confidence= -0.35 through -0.05
This means that we can be 68% confident that the teacher's VAM score would be somewhere between -0.35 and -0.05 had the teacher taught a different combination of other similar students.
Since this teacher has a VAM score that is less than zero, where the entire 68% confidence interval falls below zero, but where a portion of the 95% confidence interval lies at or above zero, this teacher would be categorized as Needs Improvement.
Standard Error
All growth measures on the FL VAM reports are estimates. All estimates have some amount of measurement error, which is known as the standard error. This value is used to create a confidence band around the growth measure, which describes how strong the evidence is that the group of students exceeded, met, or fell short of the standard.
Student Assessments
The number of student assessments included in the VAM score. This number might vary from the number of students the teacher taught.
Standard
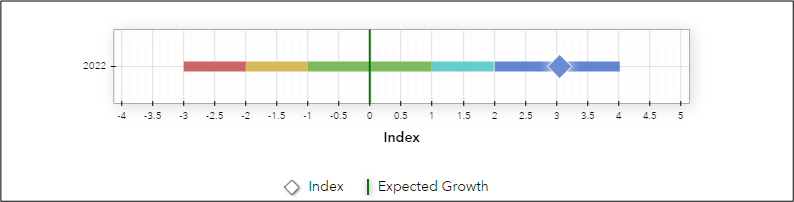
The standard represents the point at which the students' scores, on average, align with expectations.
The standard signifies the minimum amount of academic growth that educators should expect a group of students to make in a subject and grade or course. In general, this signifies appropriate, expected academic growth. Simply put, the expectation is that regardless of their entering achievement level, students served by each teacher should at least make enough progress to maintain their achievement level relative to their peers. This is a reasonable target for educators who serve all types of students. The standard is represented by a vertical green line in the graph.
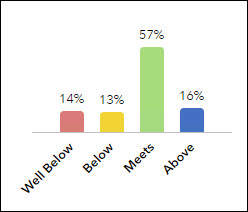
Distribution of Teachers
This distribution lists the number of teachers in each performance level in the selected grade and subject or course statewide. This enables each teacher to compare their teacher value-added results with other teachers in the state for the same grade and subject or course. It's important to understand that FL VAM does not fit teachers into a predetermined distribution. The number of teachers who appear in each performance level is determined by the amount of statistical evidence that each teacher's group of students exceeded, met, or fell short of the standard. The methodology does not predetermine the number or percentage of teachers whose values fall into each performance level range. In fact, the relative size of each performance level group varies by grade and subject or course, depending on the evidence of measurable differences in growth. |
|
Student List
To see the list of students linked to the teacher in the data, click the Student List button above the chart.
Teachers who have a Teacher Value-Added report in the selected subject, grade, or course in the most recent year have access to this report.
Performance Levels
A measure of the teacher's impact on student learning. Each raw VAM score for grade and subject is color-coded to indicate how strong the evidence is that the teacher's students exceeded, met, or fell short of the standard.
Highly Effective | There is significant evidence that the teacher's impact on student learning has been greater than expected after controlling for factors that impact student growth. |
Effective | There is evidence that the teacher's impact on student learning meets expectations after controlling for factors that impact student growth. |
Needs Improvement | There is moderate evidence that the teacher's impact on student learning has been less than expected after controlling for factors that impact student growth. |
Unsatisfactory | There is significant evidence that the teacher's impact on student learning has been less than expected after controlling for factors that impact student growth. |