Teacher Value-Added
FSA Aggregate
The FSA Aggregate is displayed in three-year, two-year, and one-year FSA Aggregate by subject and combined. The color-coded bar and "What is Included" table display data for current year aggregates, if available.
Understanding the Report
The table shows the teacher's VAM score, standard error, number of student assessments, and VAM score rating.
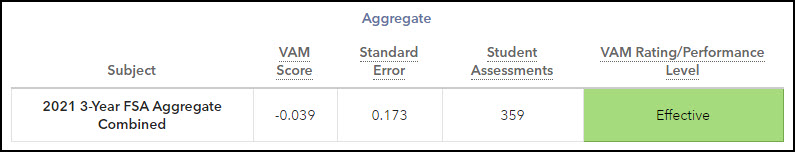
All subjects that contribute to the VAM rating are weighted by the number of students. However, the index is not simply the average of the index values for the individual subjects. This is because a new standard error is calculated, taking all the information from the included grades and subjects into account. This standard error is likely to be smaller for composites than for the individual grades and subjects because more data is used in the calculation. As a result, teacher composite index values might differ from the simple average of single-year measures.
VAM Score
The average percent that students' scores differed from expectations on these assessments as a result of this teacher's impact.
Florida law requires that at least three years of student performance data be used in educator evaluations when it is available. Because teachers sometimes teach at more than one school or in more than one grade or subject, we combine different scores for the same teacher across grades and subjects for up to three years into an Aggregate VAM Score. Except for Algebra I teachers, the Aggregate VAM Score is used in teacher evaluations. Using the average yearly growth made by students statewide in each grade and subject, the Aggregate VAM Score displays the VAM score as a proportion of that average growth. Displaying a VAM result in this manner can provide context to the number, because it represents a percentage above or below the average student growth for the year.
Standard Error
All growth measures on the FL VAM reports are estimates. All estimates have some amount of measurement error, which is known as the standard error. This value is used to create a confidence band around the growth measure, which describes how strong the evidence is that the group of students exceeded, met, or fell short of the standard.
Student Assessments
The number of student assessments included in the VAM score. This number might vary from the number of students the teacher taught.
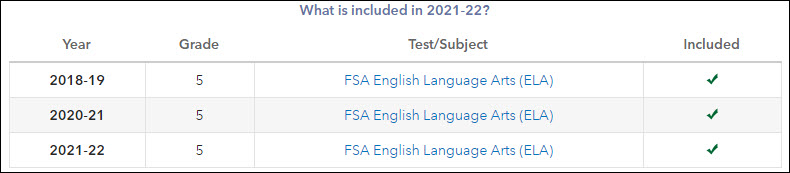
What is Included?
The report also includes a table that lists the grades and years included in the teacher's FSA three-year, two-year, and one-year aggregate. The table includes the grade and subject or test.
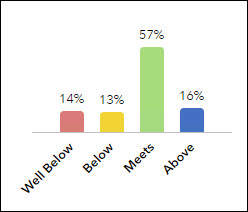
Distribution of Teachers
This distribution lists the number of teachers in each performance level in the selected grade and subject or course statewide. This enables each teacher to compare their teacher value-added results with other teachers in the state for the same grade and subject or course. It's important to understand that FL VAM does not fit teachers into a predetermined distribution. The number of teachers who appear in each performance level is determined by the amount of statistical evidence that each teacher's group of students exceeded, met, or fell short of the standard. The methodology does not predetermine the number or percentage of teachers whose values fall into each performance level range. In fact, the relative size of each performance level group varies by grade and subject or course, depending on the evidence of measurable differences in growth. |
|
VAM Score Rating
Each VAM score for grade and subject is color-coded to indicate how strong the evidence is that the teacher's students exceeded, met, or fell short of the standard.
Highly Effective | There is significant evidence that the teacher's impact on student learning has been greater than expected after controlling for factors that impact student growth. |
Effective | There is evidence that the teacher's impact on student learning meets expectations after controlling for factors that impact student growth. |
Needs Improvement | There is moderate evidence that the teacher's impact on student learning has been less than expected after controlling for factors that impact student growth. |
Unsatisfactory | There is significant evidence that the teacher's impact on student learning has been less than expected after controlling for factors that impact student growth. |
Performance Levels
Each VAM score for grade and subject is color-coded to indicate how strong the evidence is that the teacher's students exceeded, met, or fell short of the standard. For the three-year FSA aggregate, we use the VAM rating levels.
Above | There is significant evidence that the teacher's contribution to student learning has been greater than expected after controlling for factors that impact student growth. |
Meets | There is evidence that the teacher's contribution to student learning meets expectations after controlling for factors that impact student growth. |
Below | There is moderate evidence that the teacher's contribution to student learning has been less than expected after controlling for factors that impact student growth. |
Well Below | There is significant evidence that the teacher's contribution to student learning has been less than expected after controlling for factors that impact student growth. |