Teacher Value-Added
Interpreting the Data
In this graph, each raw VAM score is marked with a diamond. This value represents the amount of academic growth the teacher's students made in this grade and subject or course. On either side of the raw VAM score, you'll see marks for 68% and 95% confidence intervals. These marks create a confidence band around the raw VAM score.
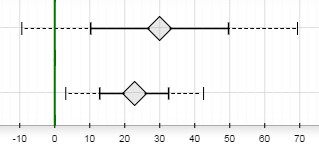
If the entire confidence band range of the 95% confidence interval is above the green line, we can say there is a significant amount of evidence, on average, that the teacher's students exceeded the standard. (This can be seen in the bottom row of the graph above.) If most but not all of the range is above the green line, there is moderate evidence that the group exceeded the standard. (This can be seen in the top row of the graph above.) Specifically, if the growth measure is between one and two standard errors above the green line, we can say the evidence that the group of students exceeded the standard is moderate. Specifically, if the raw VAM score is between 68% and 95% confidence intervals above the green line, we can say the evidence that the group of students exceeded the standard is moderate.
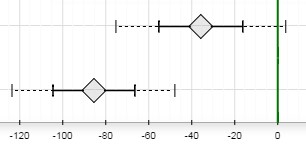
Likewise, if the entire confidence band range of the 95% confidence interval is below the green line, we can say there is a significant amount of evidence, on average, that the teacher's students fell short of the standard. (This can be seen in the bottom row of the graph above.) If most but not all of the range is above the green line, there is moderate evidence that the group fell short of the standard. (This can be seen in the top row of the graph above.) Specifically, if the raw VAM score is between 68% and 95% confidence intervals below the green line, we can say the evidence that the group of students fell short of the standard is moderate.
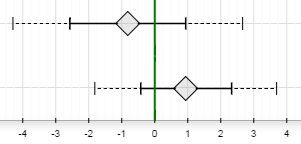
If the raw VAM score is within the 68% confidence interval above or the 68% confidence interval below, the evidence suggests that the group of students, on average, met the standard. In other words, they maintained their achievement level relative to the state distribution.